 One of the most successful things I’ve ever done as a teacher (digitally or otherwise) is creating a way for my students to track and reflect on their learning progress. It’s one of those things that seems so obvious once you do it, but it took me 11 years of teaching to finally try it out this past year. The feedback from my students was so overwhelmingly enthusiastic that I can say unequivocally: whether you’re a “high tech” or “low tech” teacher, you NEED to try this out with your students!
Learning Logs are not a completely new idea of course, in essence they are simply a progress chart, but I was reminded by reading Marzano’s classic book The Art and Science of Teaching that they can be so much more than that- especially in our new standards-based era of grading and assessment. By design, standards-based grading gives students more information, instead of an overall numerical grade they receive more specific feedback about each of their learning goals. But more information is not necessarily better. What I’ve discovered is that often students become so inundated with standards-based marks that they lose the bigger picture of what they are learning well and what they are not. And don’t even get me started about the so-called “standards-based” reporting systems (cough! cough! -PowerSchool- cough! cough!)…
The purpose of a Learning Log is two-fold: first, it is a tool that students use to keep track of the many standards-based grades they receive, in an organized way that makes it easy for them to see their progress. Secondly, the act of keeping a Learning Log gives students the opportunity to reflect on this progress, which encourages students to be proactive when there’s something they haven’t mastered yet. Learning Logs also become habit-forming; every time my student received feedback on their learning, whether it was an assessment or homework I graded, or even a quick formative assessment in class that could be peer or self-assessed, they would add it to their Log. After a couple of weeks my students were so into their Logs that they were reminding me about filling them out!
You could certainly set up Learning Logs on paper, but doing it electronically offers several advantages, which is why even if you’re not a techy person or using digital notebooks already, I still recommend you try them out using Google Apps. Doing Learning Logs with Google Apps allows you to include some automatic features that just look cool, which is an important part of getting students to buy-in. Every time a student enters a grade into their Log, a sticker pops up either congratulating them on their accomplishment or encouraging them to keep working (and believe me, even Middle Schoolers still love getting a sticker!). 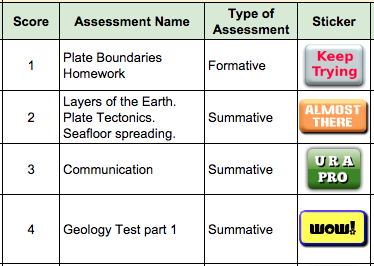
Also, the Log automatically graphs all of their grades by standard, so students have a clear visual representation of their learning progress too.

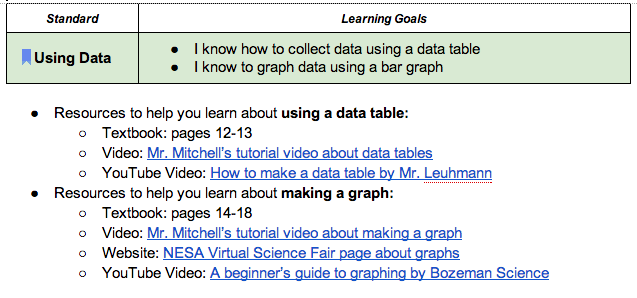
Logging each learning goal on a different page helps remind student to keep track of their learning by standard- so they understand which standards they are strong in and which need more work. But perhaps more importantly, having students take a minute or two in class to fill out their Learning Log gives them pause to reflect on this progress. In my students’ Learning Logs the last column is for writing a one-sentence reflection, where students can write a short reminder to themselves about what they need to work on, or simply celebrate their success. For the students who aren’t yet at mastery, there’s also a link on their Log to a Study Guide I create with resources like online videos, textbook pages, or websites that they can use to review (click here for an example of one of these Study Guides).
Still not convinced that you need to try Learning Logs out? I surveyed my students to find out if using Learning Logs helped them and here’s what they said (in their own 6th grade words!):
- It helps me see how I’m improving and if I got a bad grade in my learning log, I can study that specific assessment by looking at the learning log.
- By looking at the reflection I wrote I can see what areas of science I need to work on
- Every time you do something then write it down, then we see are progress.
- It helps because I can visually see how good I am.
- Learning logs tell me where I am and allow me to write my goals. Then I look back and try to complete my goals.
- It has helped me because when it comes time for a test I can look back on them and know what I need to study for.
- They let me know my formative and summative grades without having to log into PowerSchool.
- Its helped me a lot, because I can keep track of my learning progress, and when my mom asks me how I’m doing I can show her my science grades
- Learning Logs help me to see which categories I need to work more on and it helps me see my progress from the start of the unit to the end
OK, I know I’m cherry-picking responses here, but the vast majority of students’ responses were similarly positive, so it’s clear to me that Learning Logs made a big difference for students. Now that I have you on the hook- here’s a tutorial for how you can set up Learning Logs for your students using Google Apps.
Step One: Create a template for your Learning Log
First you will need to create a blank template of a Learning Log that you can share with each of your students. I use the Google App spreadsheet application called Google Sheets to create the Learning Log template (if your school doesn’t use Google Apps for Education yet, talk to your technology director ASAP and join the club!). Instead of starting from scratch, I highly recommend starting with my Learning Log example template here, and then click “File” and “Make a copy” to create your own template that you can edit.
Side note: I create a new Learning Log for each unit of study. So you’ll notice my Learning Log example template was created for our Geology unit. I do this because I believe creating a Log for the entire year would be cumbersome both for me to set up and for students to use.
Step Two: Set up the pages (sheets) of your Learning Log
For my Learning Logs I like put each standard on a separate page, or “sheets” as they are called in Google Sheets. This helps keeps students’ grades more organized by standard so they can better understand their progress on each individual standard. To create new sheets simply click “Insert” and then “New sheet”. The new sheet will appear as tabs at the bottom of the screen like this, and then you’ll want to click the small arrow next to your sheet and give it a name that represents the standard students will track on that sheet. 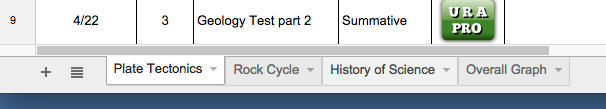
My example Learning Log template is set up for 3 standards (Plate Tectonics, Rock Cycle, and History of Science). If you need to create more sheets for more standards, the easiest way is to click on the arrow next to one of the existing sheet tabs and then click “Duplicate”. This will create a duplicate sheet which you can edit for the new standard.
On the last sheet I’ve created a graph that will automatically make an overall graph of all the grades entered in the other sheets. This was quite tricky to set up, so you can either leave it as is, delete this sheet if it’s not working for you, or if you’re technology inclined- feel free to mess around with it to suit your needs!
Step Three: Decide what data you want your students to track
The columns of each sheet are for the data that students will enter, so you’ll need to decide what’s important for your students to enter and keep track of. I have students enter the date of the assessment, the score (based on a 4-point scale), the name of the assessment, whether it was formative or summative, and then a short reflection about their progress. There’s also a column for a sticker that pops up automatically when they enter a score, but more on that later! Keep in mind, for the graph on the right side to work correctly, students need to ender the date and score columns in a specific way: the date must be month-slash-day (like 8/31) and the score must be numerical. If you have a different scoring system you may need to make some changes to my example graphs, more on that later too!
Step Four: Making changes to the stickers
If your school doesn’t use a four-point scale for grading, or you’re feeling creative and you want to make your own stickers, read on… The sticker magic takes place in a hidden column that you’ll have to unhide so you can make changes to it. To unhide the column, click on the arrows between the top of the F and H columns:
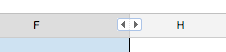
This will unhide column G, which is where I’ve added some code so the Learning Log knows which sticker to post for which score. By clicking on one of the filled cells in column G you’ll see this code:
=if(B5=4, “https://dl.dropboxusercontent.com/u/1189054/wow.png” , if (B5=3, “https://dl.dropboxusercontent.com/u/1189054/pro%20sticker.png”, if(B5=2, “https://dl.dropboxusercontent.com/u/1189054/almost%20there.png”, if(B5=1, “https://dl.dropboxusercontent.com/u/1189054/keep%20trying%20sticker.png”))))
This simple code is a series of If statements that assign a specific URL of a sticker image to each of the possible scores. By changing the URLs to your own sticker images, you can make different stickers pop up. Just keep in mind the images will need to be accessible online, so you’ll need to use something like DropBox to store and share the images (I’ve tried using public links in Google Drive, but these don’t seem to work for some reason). If you are making your own stickers, check out the site CoolText.com for an easy way to make cool text images. If you have something different than a four-point scale you can also make changes by adding or removing more If statements to this code. When you have finished editing the code, you’ll need to click on the small blue square at corner of the cell and drag it down to all the cells underneath it, which will copy your code to all these cells. 
Lastly, you’ll want to re-hide column G so students don’t accidentally mess with it. Just click on the small arrow at the top of column G and then click “Hide column”. Now your stickers should appear when a score is entered in the score column.
Step Five: Fixing the progress graphs
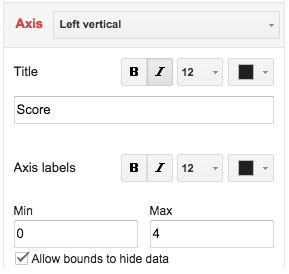
The graphs in my example template are set up to work with a 4-point grading scale, so if your school’s scale is different you’ll need to do this simple fix. For each graph, click on the graph and then click the arrow in the upper right-hand corner, and then “Advanced Edit”. Under the “Customization” tab, scroll down to find the “Axis” settings, change it to “Left vertical” and then adjust the Min and Max to suit your needs:
Step Six: Making it look cool (and more useful)
The last change you’ll want to make to your Learning Log is the title, picture and link that are on the top of each sheet. In the upper left-hand corner I added an image representing the unit of study. You can change this by clicking on it and then replacing the green URL with a different image URL in quotes, just make sure it is an online image that is publicly accessible. The top two rows of each sheet I used for the title of the unit and the title of the standard, so you’ll want to edit these to match your unit and standards, but also feel free to play around with colors and fonts to improve the look. Lastly, the third row is where I add a link to the Study Guides that I mentioned previously. You can click on this link and replace the green URL part with a link to your own study guide. I would definitely consider creating these for your students because there are so many great resources out there to them learn, and giving them the tools helps them be more proactive about their own learning.
Last Step: Sharing the Log with your students
Once your Learning Log template is complete, make sure the cells that students will enter data into are all empty, and test all the sheets of your Log with fake data to make sure it works well and looks good. Then, when you’re ready to share, you will want to students to create their own copy of the template so they have their own Learning Log they can edit. If you are already using Hapara, Doctopus, or Google Classroom- go for it, you know what to do! If not, just click the blue Share button on the upper right of your Learning Log. Under “People”, copy and paste your students’ email addresses and change it to “Can View” 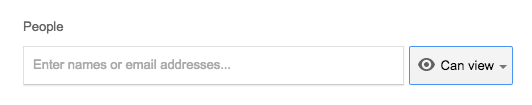
Then click the blue “Send” button and you are all set! When your students open the template Learning Log, they will need to click “File” and then “Make a copy” to create their own that they can edit. Now all you need to do is walk your students through how to use the Learning Log, help them establish the good habit of tracking and reflecting on their learning, and be amazed at how much this simple act propels their learning forward!


Wow!! Thank you so much for sharing this – I am excited to modify your template and try it out with my 7th & 8th graders this year! 🙂
You’re welcome Jennifer! Glad it’s helpful. Please share your own version when it’s ready, I’d love to see what other people do with this idea.
[…] « How to create Learning Logs using Google Apps […]
I will definitely share! Should be interesting to see how things will end up needing to be different just by virtue of all my students having iPads rather than laptops…
Just curious – how many sheets / standards do you typically have in the learning log for one unit of study?
Yes, but I think since there’s not much typing necessary for the logs, iPads should work just fine.
We typically have 3 or 4 standards per unit of study (and we’re done some “power standards” condensing to get it to this point). We’re in the process of adopting the new NGSS standards though, so it will be interesting to see how this changes things.
Thank you! I have been literally looking all summer for something I can work on… Our science and math departments in 7-12 are “going SBG” this year. I intend to use with my Life Science 7 and my Intro to Chem 11-12. I am nervous about the chem as I just renewed that licensure of mine after quite a hiatus! I am hoping this will help that demographic of kids who take my chem course: the non- College Chemistry kids… Currently going to dive into making the standards “I can-” statements and look into properly assessing those standards. I feel like i’m behind already! UGH! Thank you so much for this (diving) platform… Ready to make a splash!
Great Shannon- glad to hear this is helpful. Good luck with chemistry!
Nick, Do all of your students have devices in class regarding the digital notebooks? If not how does this look in your class?
Thanks Kerry
How can you change the legend names (plate tectonics, history of science, etc.) within the graph on the last sheet?
Hi Holly. Did you ever figure out how to change the legend names? I’m working on it right now myself and haven’t found a solution.
I know it is years later, but in case anyone else wants to know how to change the legend names, here is how I did it. There is a hidden sheet that collects all of the data from each learning goal’s sheet. The “Overall Graph” on the last sheet is created from this hidden sheet. If you click on the three horizontal lines in the bottom left corner of the screen (“All Sheets” button), you can see all of the sheets, including the hidden sheets. Pick the “Overall Data” sheet. You can change the headers of the columns on that sheet and it will fix your legend. Just make sure you hide the sheet again so your students don’t mess it up.
How do you add graph lines, if you add a page, to the overall graph?
Hi Nick, Just discovered your website, LOVE it and can’t wait to utilize it next year. My big question is how do you get the students to actually do it? Do you give them a grade for it or just give them time in class and hope they do it because it will help them? Thank you
Hi Nick, this is a helpful breakdown of how to create a learning log. I will be trying out your method to track my personal learning! I am currently upskilling in the area of Data Engineering